Disclaimer: The results provided by this calculator are for informational and educational purposes only and should not be considered professional advice.
Accuracy is not guaranteed, and you should consult a qualified professional for decisions related to finance, health, legal matters, or medical treatment.
By using this tool, you acknowledge that CalcZen.com is not responsible for any actions taken based on its results.
Mastering the Bell Curve: Why a Z Value Calculator is Your Secret Weapon for Stats
C
CalcZen.com
Updated: Jul 08, 2026
Let’s be honest: statistics can feel like a foreign language. One minute you’re talking about averages, and the next, you’re drowning in Greek letters like μ (mu) and σ (sigma). I’ve been there—staring at a textbook, wondering if I’d ever actually use a "Standard Score" in real life. But then I discovered the power of the z value calculator, and suddenly, the fog cleared.
Whether you are a student trying to ace your midterms or a professional analyzing market trends, understanding the "z-score" is like having a universal translator for data. It tells you exactly where a piece of information sits in the grand scheme of things. And at Calczen.com, we believe that finding those answers shouldn't require a PhD or a clunky, ad-filled website that crashes your browser.
What Exactly is a Z-Value, Anyway?
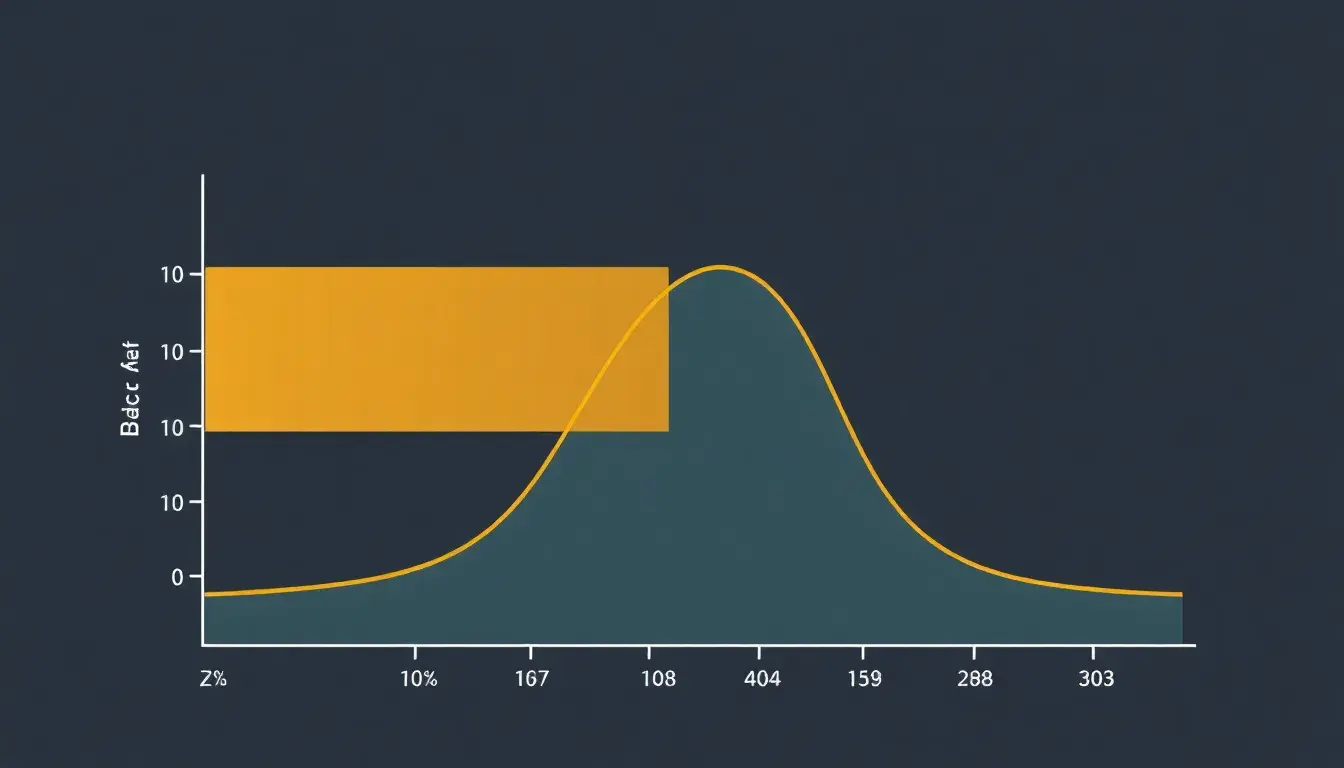
Before we dive into the mechanics of our tool, let’s break down the concept. In simple terms, a z-value (or z-score) tells you how many standard deviations a specific data point is from the mean. If your z-score is 0, you’re exactly average. If it’s positive, you’re above the pack; if it’s negative, you’re below it.
Imagine you’re taking a standardized test. You get a score of 85. Is that good? Well, you can’t know unless you know the average (the mean) and how much the scores typically vary (the standard deviation). If the average was 80 and everyone scored between 75 and 85, your score is fantastic! But if the average was 90, suddenly that 85 looks a bit different. This is where a z value calculator becomes your best friend—it normalizes the data so you can compare apples to oranges.
The Formula: For those who like to see the "engine" under the hood: $Z = (x - \mu) / \sigma$. Where $x$ is your value, $\mu$ is the mean, and $\sigma$ is the standard deviation. It's simple math, but doing it by hand dozens of times is a recipe for a headache!
Why Use Our Z Value Calculator?
I’ve tested dozens of online math resources. Some are so slow they make dial-up look fast. Others are buried under layers of pop-up ads for products you’ll never buy. When we built the tool at Calczen, we had one goal: Speed and Simplicity.
1. Instant Accuracy
You don't have time to second-guess your manual arithmetic. Our calculator handles the heavy lifting instantly. Just plug in your observed value, the population mean, and the standard deviation, and boom—your z-score is right there. It’s perfect for those late-night study sessions when your brain is too tired to remember where the decimal point goes.
2. Clean, Ad-Light Experience
There is nothing worse than trying to concentrate on Math & Algebra Tools while an auto-playing video ad screams at you. We keep things tidy. Our interface is designed for humans, not for ad bots. It’s sleek, responsive, and works beautifully on your phone while you’re on the bus or at your desk on a widescreen monitor.
3. Real-World Context
We don’t just give you a number; we help you understand what it means. Using a z value calculator allows you to calculate probabilities. For instance, if you find your z-score is 2.0, you know you’re in the top 2.2% of the population. That’s a powerful insight for everything from quality control in manufacturing to evaluating your personal fitness progress.
Step-by-Step: How to Calculate Like a Pro
Ready to give it a whirl? Here is how you use our tool to get perfect results every time:
Input the Mean (μ): This is the average of your data set. Think of it as the "anchor" point.
Input the Standard Deviation (σ): This tells the tool how "spread out" the data is. A small number means everyone is close to the average; a large number means things are all over the place.
Input the Raw Score (x): This is the specific value you’re curious about. Your test score, your height, your monthly sales—whatever you want to measure.
Hit Calculate: Our algorithm processes the subtraction and division in milliseconds.
For more technical details on the underlying distribution theory, you can always check out the Wikipedia entry on Standard Scores, but for the actual work? Stick with us.
Tired of Clunky Math Tools?
Stop fighting with your spreadsheet and start calculating with confidence. Our Z-Value Calculator is fast, free, and waiting for your next data set.
Even with the best z value calculator, "garbage in equals garbage out." Here are a few tips I’ve learned the hard way:
Watch Your Signs: If your value is below the mean, your z-score must be negative. If our tool gives you a negative number, don't panic! It just means you're on the left side of the bell curve.
Standard Deviation vs. Variance: Make sure you’re inputting the standard deviation, not the variance (which is the deviation squared). If you have the variance, just take its square root before plugging it in.
Sample vs. Population: While the math is similar, ensure you know if you're dealing with a whole population or just a small sample. Our tool is optimized for standard population parameters.
Wrapping Up: Calculate Smarter, Not Harder
At the end of the day, statistics is about making sense of a chaotic world. Whether you’re comparing stock market returns or just trying to understand your "percentile" at the doctor's office, the z value calculator at Calczen.com is the bridge between raw data and real understanding.
I’ve spent years looking for tools that don't get in my way. Calczen is the result of that search. We’re here to help you save time, reduce stress, and get back to what matters most. So, the next time you’re faced with a mountain of data and a looming deadline, remember: you don’t have to do it alone. Bookmark us, use our tools, and let’s make math a little less intimidating, one calculation at a time.